Friday, December 26, 2014

Importing data into Papeeria

This help article describes how to import data (text files, images, etc.) into Papeeria from external sources

Import from URL

If a file is somewhere on the Internet and you can access it from your web browser, then you can import that file into Papeeria and update it from time to time with a single click.

Possible use cases

  1. You have a computing job somewhere which exports its results as comma or tab separated values file. You want to import the results into Papeeria to build a plot and want to update it when results change. For instance, you may want to pull crude oil prices data from Quandl
  2. You run R script on your laptop and it writes a graph into Dropbox folder. You want to use that image in your paper and update it the next time your run your R script
  3. Your colleague keeps his part of a paper which you collaborate on in GitHub. You want to pull his text into Papeeria from time to time
How it works

Use Import from URL menu item in the workspace menu in the top-left corner of Papeeria workspace. In a dialog you can either create a new file with contents taken from some URL or update already imported files. When you click Update, we send requests, get file contents and write them into associated files in your project. If we have issues with fetching contents, we report them.

Important to know

Many web file storage services provide links which you can share with your colleagues, but very often such links are supposed to be used by human. They lead to a web page with "Download" button and human is supposed to click that button to start downloading. Papeeria is not a human, and it needs a link to "raw" file (that one which human gets by clicking "Download"). Some services, such as GitHub, provide a link to "raw" file in their UI, but some don't. For instance, it is non-trivial to get a raw link from Dropbox or Google Drive interface.

We created a heuristic which transforms a link to Dropbox download page into a link to raw file. So when you paste a link generated by Dropbox into Import from URL dialog, we'll automatically change it.

We do the same thing for converting a link to GitHub's file viewer into raw link to file contents. E.g. we will automatically convert this link to README.md in our repository to its raw link

Monday, December 22, 2014

Курсор Папирии, выпуск от 19 декабря

В номере: импорт файлов из интернета; поддержка восьмибитных кодировок

Импорт файлов из интернета

Предположим, что вы гоняете вычисления где-то в облаке или на суперкомпьютере в лаборатории, получаете результаты в виде CSV файла и хотите загнать их в график или таблицу в отчете или статье в Папирии. Теперь это стало легче. В Папирию теперь можно закачать файлы с любого URL, публично доступного по протоколу HTTP(s). Кроме того, мы запоминаем URL, с которого скачали файл, и если вы знаете, что оригиналы файлов изменились, вы можете одним кликом все обновить.

Импортирование CSV файлов с ценами на нефть с сайта Quandl

Эта фича может работать в качестве простенькой интеграции с  Dropbox и GitHub. Если вы какими-нибудь скриптами на R или Python генерируете сложные графики и выкладываете их на публичный Dropbox, или если вы какую-то часть работы храните в GitHub, то вы можете с помощью этой новой фичи затащить файлы в Папирию.

Обратите внимание, что вообще-то мы импортируем ровно то, что доступно по указанному URL. Но обычно, когда вы просите у Dropbox дать вам ссылку на файл, вы получаете ссылку не на сам файл, а на страницу с кнопкой Download. Ссылка на "сырой" файл от неё немного отличается. Но мы правильно съедим и ту и другую.

Import From URL находится в проектном меню, рядом с Upload File. Над настоящей интеграцией с Dropbox, GitHub и Google Drive мы работаем. Не вешайте трубку.

Странные архаичные кодировки

Большинство людей не интересуется  кодировкой текста, потому что пишет на английском. Те, кому нужны символы, на входящие в Latin-1 -- например кириллические -- скорее всего сейчас используют UTF-8. Но еще несколько лет назад они были бы вынуждены использовать восьмибитные кодировки, такие как Windows 1251 или КОИ8-Р. Есть много пакетов и всяких стилей, которым нужна одна из восьмибитных кодировок, потому что с Unicode у них проблемы разной степени критичности.

У нас везде используется UTF-8, но мы сделали конвертацию текста из Unicode в восьмибитную кодировку непосредственно перед запуском компилятора. Разумеется, при условии что конвертация в принципе возможна.

Восьмибитные кодировки в настройках демнострационного проекта

Сейчас доступно всего две кодировки, но если вам нужна какая-то еще, дайте нам знать.

Legacy 8-bit charsets in Papeeria

Papeeria keeps text files in UTF-8 and that's okay for most of the users. They either write in plain English or are happy with UTF-8 support in the modern TeX. However, there are legacy packages, document classes and bibliography styles which work best when user input is in a "legacy" 8-bit charset, such as Windows 1251 or KOI8-R, and some people need those packages for compiling. Usually documents which may need legacy charsets have something like this in the preamble:

\usepackage[cp1251]{inputenc}

Papeeria can convert your text files from UTF-8 to 8-bit charsets before feeding them to TeX compiler. You can choose compile-time encoding in the project settings on the dashboard. Select a project, go to "Configuration" tab in the right pane and choose appropriate charset


We've added just two charsets which are the most popular in the Russian TeX community. If you need other charsets, please let us know.

Saturday, December 20, 2014

Papeeria New, Dec 19

TL; DR: Import files from Internet; use legacy charsets

Import file from URL

So you run your computing jobs somewhere in the cloud or on a supercomputer in your lab and want to pull the latest results into Papeeria to build a plot or a table? This just have become easier. You can now download data into Papeeria project from any public available URL over HTTP(s) protocol. Moreover, Papeeria remembers the original URL and allows for updating  downloaded resources when originals change.

Importing crude oil data as CSV files from Quandl

It may also serve as poor man's Dropbox and GitHub integration. If you write complex plots produced by R or Python scripts to public Dropbox folder or collaborate with your colleagues using GitHub, you can pull files you need into Papeeria with Import from URL function.

Note that in general you'll need URL pointing to raw data. Normally when you request a "shareable link" Dropbox gives you a link to its own page with "Download" button. However, you can paste it into Import from URL dialog and we will automatically transform it into raw URL.

Import from URL sits in the workspace menu, next to Upload File. We're working on the real Dropbox, Google Drive and GitHub integration, stay tuned.

Strange legacy charsets

Many people don't even think about charsets because they write in English, and many of those who need to use other charsets, such as Cyrillic, use UTF-8. However, just a few years ago they had to use 8-bit charsets, such as Windows 1251 or KOI-8R (have you ever heard about that?) and there are legacy packages and styles which rely on these charsets.

Papeeria uses UTF-8 everywhere, but for those who need legacy charsets, we added an option to convert project files before running TeX compiler. There is just a couple of charsets at the moment, but if you need some other one,  please let us know.

Legacy charsets in the sample project settings


Monday, December 8, 2014

Зимние распродажи и подарки от Деда Мороза

Зима бывает прекрасной

Становится холоднее, зима уже пришла, а Новый Год на подходе. Мы начинаем сезон подарков и сюрпризов с Прекрасного Понедельника.

Только 8 декабря мы предлагаем годовую подписку на план Дельта за полцены. Не упускайте шанс заполучить редактор и компилятор ЛаТеХа в облаке в компании с компилятором графиков за $30 вместо $60. Предложение действительно до полуночи по тихоокеанскому времени (11 часов 9 декабря по московскому времени)

Прекрасный Понедельник продлится всего один день, но в течении всей зимы вы можете получить подарок от Деда Мороза. Для этого требуется только использовать Папирию в своей работе. Чем чаще используете, тем больше шансы познакомиться с Дедом Морозом. Ну и диплом заодно начнете пораньше писать.
Удачи!

Gifts from Ded Moroz on Cool Monday and afterwards

When Monday is really Cool

Weather gets colder, winter is already here and New Year is coming. We're starting the season of gifts and surprises with Cool Monday sales. 

On December 8th we offer annual subscription to plan Delta at half-price. Don't miss the chance to get a year of full featured online LaTeX editor, compiler and plot builder for only $30 instead of $60. Cool Monday offer is valid until the midnight Pacific Time.

Cool Monday is just a single day, but you may get a gift from Ded Moroz during the whole winter. Everything you need is to use Papeeria. The more you use it, the higher is your chance!

Курсор Папирии, выпуск от 5 декабря

В номере: пользовательские метки для шаблонов; построение красивых графиков при помощи gnuplot

Встроенный gnuplot

Графики и диаграммы в исследовательской работе очень важны, и их, естественно, хочется держать под рукой, рядом с текстом. В Папирию теперь встроен gnuplot, одна из нескольких мощных систем для построения графиков. Сам по себе gnuplot управляется из командной строки, что, конечно, многих может остановить, но для них мы еще несколько месяцев назад сделали простой интерфейс, позволяющий сделать несложный график буквально в несколько кликов. А истинным ценителям мы предлагаем пользоваться всеми возможностями gnuplot.

График цен на нефть, построенный в Папирии при помощи gnuplot.

Начиная с выпущенной в пятницу Папирии v33, пользователи, подписанные на план Дельта, могут запускать "сырые" gnuplot скрипты и генерировать из своих данных высококачественные масштабируемые графики. Подробности можно почитать в небольшом учебничке "построение графиков в Папирии".

Пользователи плана Эпсилон по-прежнему могут использовать "контролируемый" gnuplot через графический интерфейс.

Надо ли говорить, что в этих графиках можно использовать LaTeX? Скажи "нет" ужасным формулам на своих картинках.

Пользовательские метки к шаблонам

У нас, напомним, есть шаблоны документов, а у них есть метки, по которым можно искать нужный шаблон. Набор меток был до сих пор фиксирован, а теперь пользователи могут добавлять новые. Если у вашей кафедры или лаборатории есть свой фирменный шаблон, его можно пометить соответствующей меткой, например type:thesis lang:ru org:spbu

Чтобы добавить метку, выделите шаблонный проект в панели управления, ткните в edit tags и в появившемся диалоге выбирайте существующие метки или создавайте новые.

Метки живут в панели управления

Редактор меток

Обратите внимание, что метки постмодерируются. Метку можно использовать сразу после создания, но мы можем ее впоследствии переименовать, объединить с другой меткой или даже удалить, дабы не увеличивать хаос и не плодить двойников. Поэтому если вы создаете новую метку, то убедитесь, пожалуйста, что у нас есть адрес вашей электронной почты, чтобы могли, если понадобится, с вами связаться. Адрес можно указать на странице настроек

В настоящее время прицепить метку можно только к шаблонным проектам и все метки являются публичными, даже если они прицеплены к приватным проектам. Приватные метки скоро появятся.

Friday, December 5, 2014

Managing Papeeria cookies

Introduction

Cookie is a small piece of text data which is downloaded from a web site, stored in a web browser and associated with a browser user and visited web site. They may store information which is essential for providing the requested service and may store non-essential information which may help web site with improving service and user experience.

According to so-called "European Cookie Law" (Privacy and Electronic Communications (EC Directive) (Amendment) Regulations 2011) we are required to gain user's consent to store non-essential cookies.

You can find more information about the Cookie Law on the internet. This article on Wired is good read.

Cookies set by Papeeria

Papeeria.com website sets three kinds of cookies.

  1. Authentication cookie which is essential for providing service. It is a session cookie, it is set when user signs in and cleared when user signs out.
  2. User preferences cookies, which include chosen interface language and authentication method. They help us to show greeting and last used sign in method in the sign in widget. These cookies are persistent and live longer than one session
  3. Google Analytics cookies which track your visits of our site pages. These cookies are persistent and anonymized

Consent to use non-essential cookies 

You opt-in and give us your consent to set non-essential cookies when you sign up or later sign in into Papeeria, as warning in the sign-in dialog and corresponding section in the Terms of Service declare. 

Opt-out

We're working on implementation of opt-out from using non-essential cookies.

Clearing cookies

Should you decide to clear all cookies set by Papeeria, you can do it in your web browser settings. We will add an easy way to clear all cookies with a single button click on our website later.

Chrome
Click application menu button, then choose Settings, find "Content settings..." button in Privacy section (sits in Advanced settings. Searching for "cook" in the search box helps a lot). In the Cookies section of Content Settings dialog click "All cookies and site data" button, search for "papeeria.com" and either click "remove all shown" or remove individual sites with close buttons.

Papeeria News, Dec 5

TL; DR: use custom tags on template projects; build awesome plots with gnuplot integration

Gnuplot integration

Plots and graphs are important aspects of a scientific research, and we naturally want to have them always at hand next to our text. There is a number of plotting systems and services around, and one of them, called gnuplot is integrated into Papeeria. Although gnuplot itself is command-line driven, we launched UI for constructing simple plots a few months ago. Today we announce deeper gnuplot integration.

Oil prices graph built using gnuplot in Papeeria

As of Papeeria v33, customers who are subscribed to plan Delta can run "raw" gnuplot scripts and produce high quality plots from their data. Check out our help pages to learn more. Those who use free Epsilon plan can still build simple plots using "managed" gnuplot.

Needless to say that we support LaTeX in plots. Unuglify maths in your figures :)

Custom tags on template projects

We have a number of "built-in" tags which help with searching for a template for your new document. Now you can tag your template projects and define your own tags. Select your template project in the dashboard and click edit tags. In the tags dialog you can add one of the existing tags or create a new tag. Whether you are creating a technical report template for your workgroup or custom presentation template for your department chair, or maybe an article template for a conference proceedings, you can benefit from using tags.

Tags interface in the Dashboard

Tag editor

Please keep in mind that tags are subject to post-moderation. Once created, tag becomes visible immediately, but we may rename, merge or even delete it later, to avoid collisions and inappropriate tagging. When you create a new tag, please make sure that we have your email on file, so that we could contact you if we have questions. You can set your email on the Settings page.

At the moment being it is possible to tag template projects only and all tags are public, even if applied to private projects. Private tags will come soon.

Using Plot Builder in Papeeria

This help article describes how to use plot building tool.

Scenario

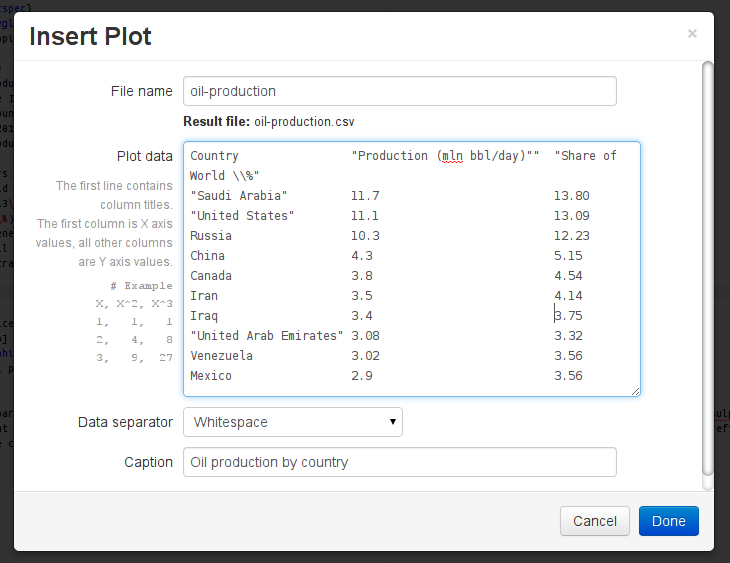
Suppose you've got some data and you want to build a histogram and insert it into your paper. Let's take oil production stats as an example
Country                "Production (mln bbl/day)""  "Share of World \\%"
"Saudi Arabia"         11.7                         13.80 
"United States"        11.1                         13.09
Russia                 10.3                         12.23
China                  4.3                          5.15
Canada                 3.8                          4.54
Iran                   3.5                          4.14
Iraq                   3.4                          3.75
"United Arab Emirates" 3.08                         3.32
Venezuela              3.02                         3.56
Mexico                 2.9                          3.56
Oil production data taken from Wikipedia

Adding a plot

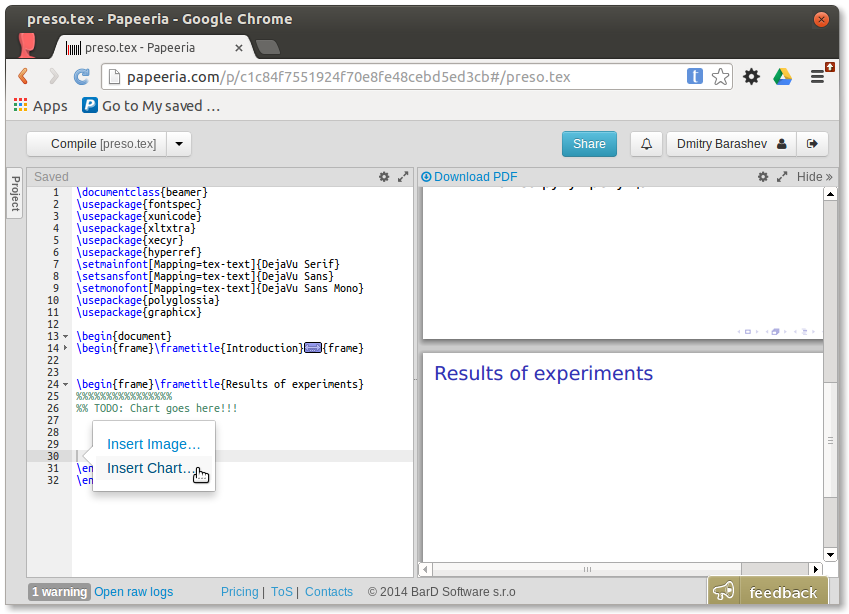
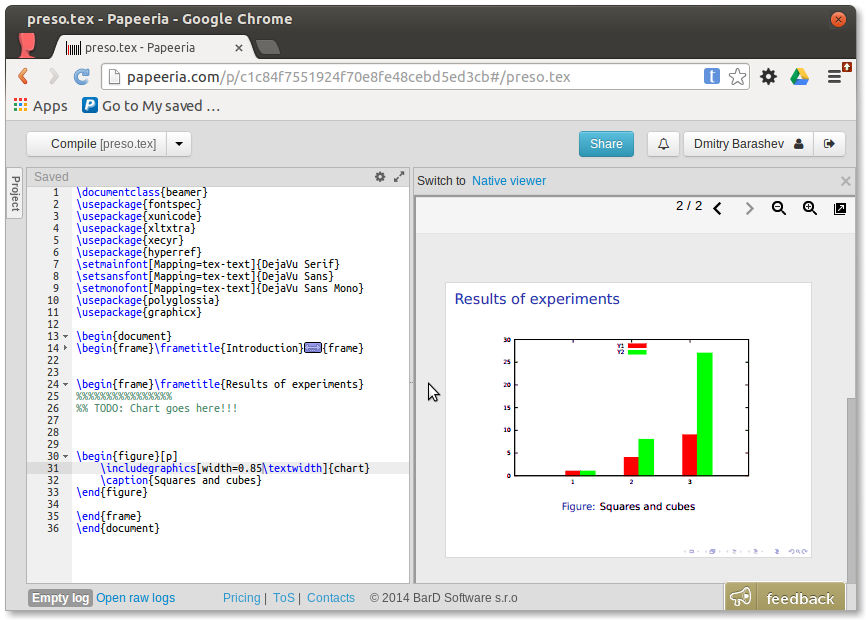
Adding a plot into LaTeX document involves a few steps: one needs to create a plot itself and then insert a plot into the text as a figure. In Papeeria you can do all this stuff quickly: place caret where you want to add figure tags, hit Alt+Insert and choose Insert Plot from the context menu.
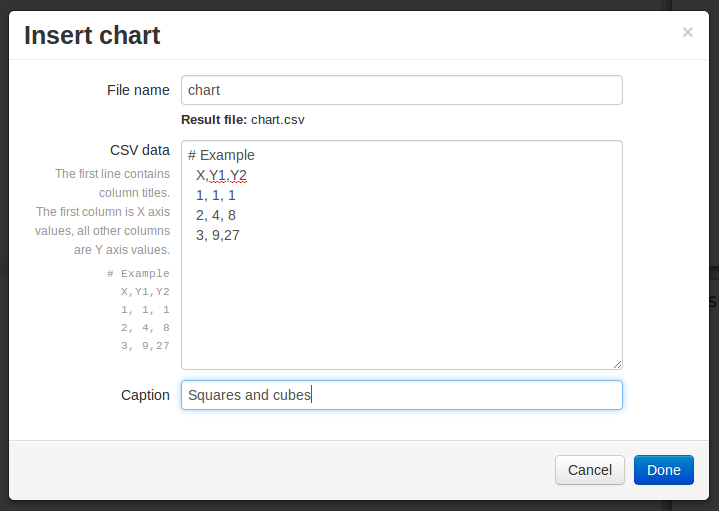
Insert Plot dialog

Paste your data into the text area, choose file name where data will be saved to, choose column delimiter and optionally figure caption. Click Done and Papeeria will add data file into the project, compile PDF file with a histogram and insert figure tags at the caret position.
Hint: choose column delimiter appropriately and quote values which contain delimiter substring (especially important when delimiter is whitespace)
Month   "Price in Euro"
2012-01 86.2344
2012-02 89.7464
2012-03 94.2123
2012-04 91.3811
2012-05 86.0061
2012-06 76.4181
2012-07 83.3615
2012-08 90.4529
2012-09 87.9202
2012-10 85.5900
2012-11 84.8372
2012-12 82.7839
2013-01 84.1874
2013-02 86.7123
2013-03 84.1555
2013-04 79.3453
2013-05 79.2452
2013-06 78.3375
2013-07 81.8711
2013-08 82.5541
2013-09 83.0109
2013-10 79.9776
2013-11 80.0078
2013-12 80.7921
2014-01 78.7576
2014-02 79.4208
2014-03 77.7698
2014-04 78.1769
2014-05 79.4203
2014-06 82.2801
2014-07 79.9469
2014-08 77.5741
2014-09 76.4254
2014-10 69.4637
2014-11 64.3892
Oil price data from
European Central Bank web site

Live preview

When data file is opened in the editor, it is possible to preview the compiled plot by ticking "Show plot preview" checkbox. We refresh plot in the preview as you type. If it fails to compile because of error in data or some other reason, we show a cached plot.

Plot settings

Cogs icon above the editor with opened data file provides access to plot settings pane. You can change plot style, data columns delimiter, position legend appropriately, define axis names, change ticks format and rotation. Most of the options are quite simple, with tics label format being the most tricky. Please refer to gnuplot docs to learn about format specifiers. At the moment we take tic labels for X axis from the first column in the data file.

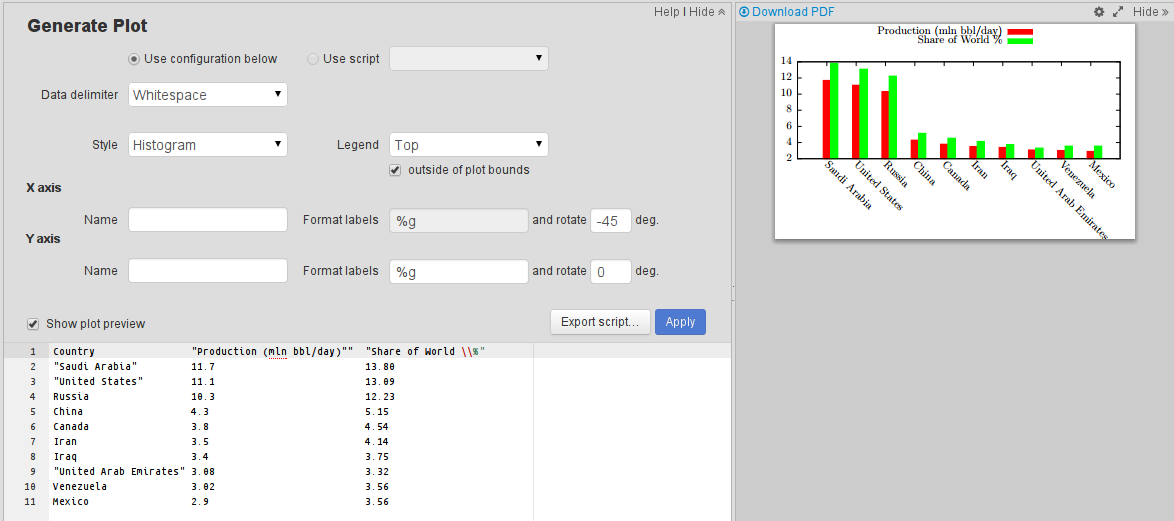
Plot settings pane and live preview

Advanced plotting

Behind the scenes we compile plots with gnuplot and xelatex. Users of free Epsilon plan don't have many tuning options, however, customers who are subscribed to paid plan Delta have access to raw gnuplot scripts and can enjoy almost all gnuplot features.

Let's build a graph of oil price changes and tune it a little bit. Quick plot created with Insert Plot action looks as shown below. We want to make X tic labels less dense, change colors and line style a little bit and add a dashed line at the mean value of oil prices.

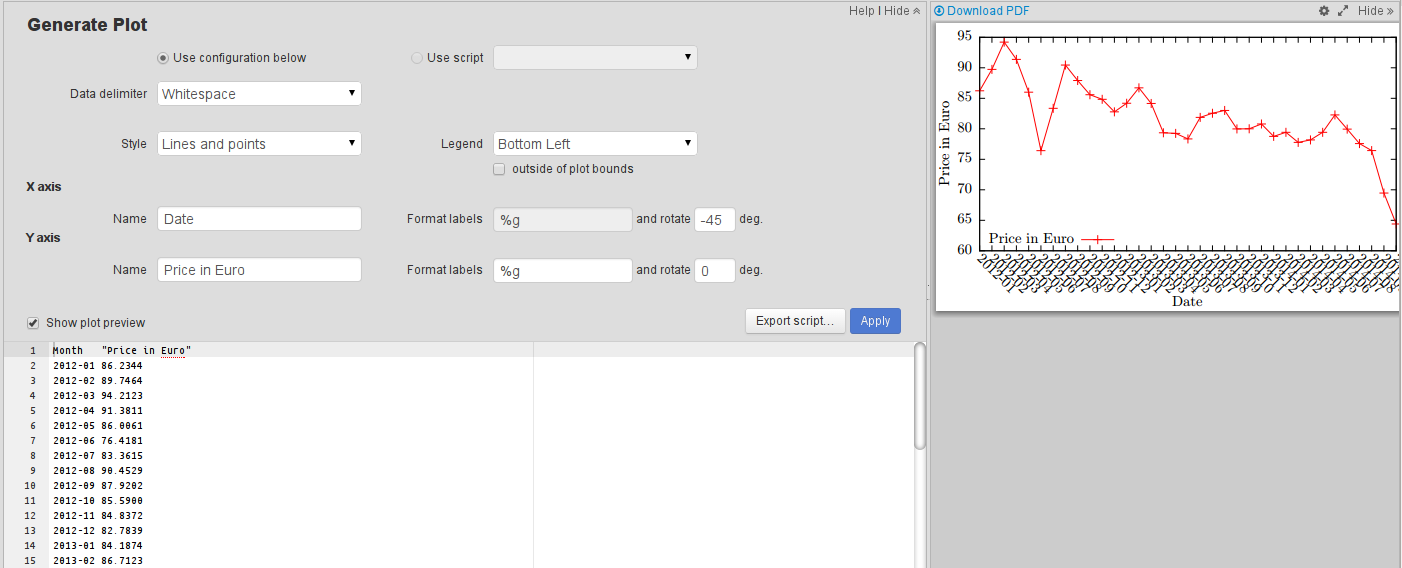
Initial oil prices plot

So let's start with exporting our plot to gnuplot script. Click Export script button, choose script file name (it is important keep .gnuplot extension) and location and leave Use as input checkbox switched on to feed your data to the generated script. Open the generated .gnuplot file in the editor and paste the following code. We hope comments in the code are explanatory enough.

# Code generated by the plot builder
set datafile separator whitespace
set key autotitles columnhead bottom left
set style data linespoints
set style fill solid 1.0
set format x "%g"
set xtics rotate by -30
set format y "%g"
set ytics rotate by 0
set xlabel "Date"
set ylabel "Price in Eur"

# Calculating mean value using constant fitting function
f(x) = mean_y

# '<&3' takes input from the file with descriptor number 3. 
# If you checked "Use as input" checkbox when you
# generated a script then your data file will be associated with this descriptor.
# If you have another data file in your project and want to use it here,
# you may just use relative file name
fit f(x) '<&3' u 0:2 via mean_y

# Placing label on the plot. Yes, you can use LaTeX!
set label 3 gprintf("Mean =$\\frac{\\Sigma_i price_i}{N} = %g$", mean_y) at 1, 65

# required to enable dashed line types 
set termoption dash

# blue-ish solid with width 2 and small round shaped dots
set style line 1 linecolor rgb '#0060ad' linetype 1 linewidth 2 pointtype 7 pointsize 1

# keywords can be abbreviated:
# red-ish dashed width 2, dots undefined
set style line 2 lc rgb '#dd181f' lt 2 lw 2

# this function returns non-empty string with the value of column number "labelcol"
# for every fifth value of column countcol (0 is the column with ordinal numbers of
# the rows in the dataset)
everyfifth(numcol, labelcol) = (int(column(numcol)) % 5 == 0) ? stringcolumn(labelcol) : ""

# Plot our data using line style 1 (defined above) and mean function
# using line style 2
plot '<&3' using 0:2:xtic(everyfifth(0, 1)) ls 1, f(x) ls 2

Papeeria tracks edits in both data and script file and in a few moments it will recompile the plot. The result is much more appealing:

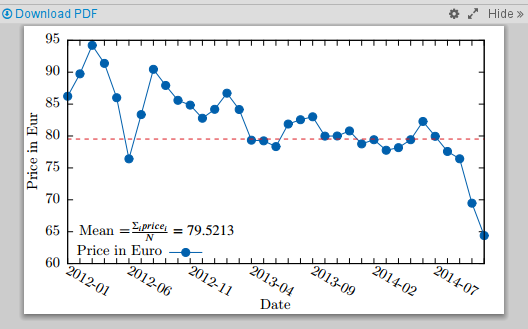
Oil prices plot after tuning

Now we can go back to our text and compile it. Figures are already there, we may need to adjust their placement using optional argument of the figure environment and enjoy the result.

LaTeX in plot labels

Plot labels are compiled with xelatex, so you can use maths and other LaTeX features.
Hint: you need to double-escape with backslash symbols which carry special meaning to LaTeX, such as percent symbol (see the first data sample above)

Connecting data files and script files

You may want to create different scripts and choose which one to use to process your data file in the plot settings pane. You can also link a few data files to the same script, and they will recompile automatically when you change the script file.

Help on gnuplot

Admittedly gnuplot is not the easiest plotting system. If there is an issue with your script and gnuplot writes something to the log, we'll show it in the log pane. However, sometimes log records may not be very helpful. If you're struggling with gnuplot scripts, here is a short list of useful links:

Known limitations and future work

At the moment being plots don't play well with project versions and project clones. We are working on this and will fix the issues shortly.

We plan to enhance plot builder capabilities and add other plotting systems. Don't hesitate to file tickets to our bug tracker or uservoice!

Want to stay in touch?

Follow us on Twitter: http://twitter.com/Papeeria
On Google+: http://google.com/+Papeeria
and VKontakte: http://vk.com/papeeria

Love Papeeria? We need your feedback!

We'll appreciate if you take a few minutes of your time and write a review on our Google Web Store pages. Any language is okay and no flattering is required. Just be honest!


Tuesday, November 25, 2014

Project sharing

This article explains how project sharing works in Papeeria.

Short summary

When Alice who is Papeeria user wants to collaborate on her project with Bob who is not yet registered she
  1. Asks Bob to register on Papeeria and sign in
  2. Generates a sharing link and sends it to Bob
  3. Having signed in, Bob clicks the sharing link and joins the project
See the details below.

Sharing options

If you want to share your project with someone, you have a few options.
  • You can grant access to a few people of your choice, with either read or write permissions. 
  • You can also make your project public, and everyone will be able to read and compile your project. However, even in public projects only those users who are explicitly granted write access will be able to edit files.

All these options are available in the Sharing Settings dialog which you can open using Share button in the workspace or in the dashboard.

Sending invitations

If you want to invite your colleague to join your project, you need to contact him and give him some key or secret. If you were sitting in the same room, you could just say "Hey, dude, let's work on this together! Go to Papeeria and use s3Cr3Tw000rD to access the project". Your peer signs into Papeeria, types the secret word and you're done.

Sharing dialog

Sharing dialog works exactly that way, but uses secret links instead of words. The easiest scenario looks as follows
  1. Generate a pair of secret links by clicking On radio button in Link Sharing section.
  2. Choose Read or Write link and click it to copy to the clipboard
  3. Send the link using your favorite communication tool
Your collaborators need to be registered and signed in in order to be able to join with you in collaborating. Links are long-lived, you can send the same link to any number of people. If you need to invalidate the links, switch Link Sharing off. This will make previously generated links invalid and if you decide to switch link sharing back on, you will generate new links.

We can also send one-off links to your collaborators by email. They work the same way, except that we automatically send an email and automatically invalidate the link once it is used. To send one-off links:
  1. Type collaborator's email addresses Collaborators table, change permissions if needed and click Add
  2. Optionally add a text message to be wrapped into the email
  3. Click Done

Email recipients will have to register and sign in, and once they click the invitation link they will gain the associated permission to read or write your project.

Managing access

No matter what link did you use to share the project, all collaborators show up in the table and you can manage their permissions or revoke access completely.

Tuesday, August 26, 2014

Papeeria News, Aug 26

TL;DR: an option to buy more private project quota

You can now increase your private project quota and get more projects than your pricing plan includes. We offer a unit of 5 projects for $12 yearly. Payment button is available on the pricing page. Additional quota adds to what your pricing plan includes, so if you're on Epsilon and buy 5 private projects then you get 6 projects totally.

New option to buy private project quota

Курсор Папирии, выпуск от 26 августа

В номере: возможность увеличения квоты приватных проектов

Если вам по каким-либо причинам хочется увеличить квоту приватных проектов, не меняя тарифного плана, то теперь можно это сделать. Кнопка живет на странице с ценами. Пакет из пяти приватных проектов стоит $12 в год. Дополнительная квота суммируется с предусмотренной тарифным планом.

Новая опция увеличения квоты

Thursday, August 14, 2014

Курсор Папирии, выпуск от 14 августа

В номере: Пользовательские шаблоны документов и улучшенная контрольная панель в мобильной версии

Пользовательские шаблоны документов

До сегодняшнего дня у нас был небольшой предопределённый набор шаблонов документов, в который входили заготовки простых документов и презентаций, дипломной работы и несколько шаблонов для статей ACM, Springer и SIAM. В сегодняшнем обновлении добавлена возможность использования любого проекта в качестве шаблона. Эта опция находится в контрольной панели, прямо под превью проекта.

Опция включения проекта в список шаблонов


Когда опция включена, проект появляетсяв списке шаблонов  в диалоге New Document. Если проект-шаблон публичный, то любой пользователь Папирии сможет создавать на его основе свои документы. Дополнительно, пользователи платных планов могут использовать в качестве шаблонов свои приватные проекты.

Шаблоны, созданные конкретным пользователем, идут в его списке шаблонов первыми, за ними следуют наши встроенные шаблоны, а потом уже все остальные публичные шаблоны.

Пользовательский шаблон в диалоге New Document

Улучшенная контрольная панель в мобильной Папирии

В мобильной Папирии контрольная панель стала полнофункциональной: всё, что есть в десктопном варианте, доступно и в мобильном. Расшарить проект или сделать новую версию можно теперь прямо со смартфона или планшета.

Контрольная панель на экране планшета

Papeeria News, Aug 14

TL; DR: User-defined document templates and mobile dashboard improvements

User-defined document templates

Until today we provided a predefined set of document templates which included simple texts and Beamer presentations, a few ACM, Springer and SIAM article templates and some other docs. Today's update adds an option of publishing any project as template. The option can be found in the Dashboard, just below the project preview image.

Publish project as template


When this option is checked, project appears in New Document dialog. If template project is public then any Papeeria user can use it for creating new documents. Users of paid pricing plans can also use their private projects as templates. Templates owned by user go first in the list, followed by our predefined templates. Public templates created by other users appear at the end of the list.

Custom template in New Document dialog

Mobile dashboard improvements

Papeeria Mobile now offers a dashboard which as functional as one in the Desktop edition. You can share projects, rename them, create new revisions from your smartphone or tablet.

Papeeria Mobile dashboard on tablet screen

Monday, August 4, 2014

Papeeria News, Aug 4

TL;DR: Papeeria Mobile updates -- real-time collaborative editing and context menu in the project pane

Real-time collaborative editing 

Papeeria Mobile users do not block files for writing anymore. They see other collaborator's carets and receive their updates. In order to keep text readable on small screens,  we do not show (yet) the names of other collaborators in mobile editor.

Real-time collaborative editing in Papeeria Mobile

Context menu in the project pane

Operations with files are available from now on in Papeeria Mobile

Context menu in the project pane


Курсор Папирии, выпуск от 4 августа

В номере: новые фишки мобильной Папирии - совместное редактирование и контекстное меню для списка файлов

Совместное редактирование

Пользователи мобильной Папирии больше не блокируют файл на запись, видят курсоры и действия других пользователей. В мобильной версии в курсорах имена соавторов (пока) не показываются, дабы не замусоривать маленький экранчик.

Мобильная Папирия с совместным редактированием

Контекстное меню

С файлами в панели проекта теперь можно делать те же операции, что и в десктопной версии.

Контекстное меню в списке файлов

Friday, July 11, 2014

Papeeria News, July 11

TL;DR: real-time collaboration

That's it, basically. If you're working on a project with your colleagues, you can enjoy real-time editing from now on, provided that collaborators have write permissions. This feature is available on all pricing plans.

Real-time collaboration

Every editor can see carets and names of other collaborators (hint: you can toggle names with Alt+C shortcut). Our server continuously merges edits into a single document. Normally it succeeds, but if for some reason merging fails, it notifies appropriate users.

Users of Papeeria Mobile will continue blocking files which they edit for a while, but we're working on removing this restriction.

Grigory who has been working hard on this feature for a few months is just a superman.

Notifications in Papeeria Mobile

Besides real-time collaboration, this update brings notifications to Papeeria Mobile. Thanks to Alexander for that!

Notifications in the mobile interface

Stay tuned! New cool features are coming!

Курсор Папирии, выпуск от 11 июля

В номере: совместное редактирование в реальном времени

В общем-то можно больше ничего и не добавлять. Если в проекте несколько соавторов с правом на запись, то они теперь могут одновременно редактировать один и тот же файл. Фича доступна на всех тарифных планах.

Совместное редактирование

У каждого редактирующего пользователя отображаются курсоры и имена соавторов (имена можно спрятать, нажав Alt+C). Наш сервер делает всё возможное, чтобы свести одновременные правки в единый текст. Чаще всего это удаётся, но если вдруг не получилось, то вам об этом скажут.

Пользователи мобильной версии пока что по-прежнему блокируют файл на запись. Но мы надеемся, что скоро и они смогут полноценно использовать эту фичу.

Гриша, терпеливо делавший эту крутую и сложную вещь всю весну -- большой молодец!

Нотификации в мобильной версии

Кроме совместного редактирования в этом обновлении в мобильной версии появились уведомления об изменениях.

Нотификации в мобильной Папирии

Мобильную Папирию у нас по-прежнему без устали пилит Саша.

Оставайтесь с нами. Впереди ещё много вкусного!

Thursday, June 19, 2014

Papeeria News, June 18

Tl;DR: Papeeria Mobile update and bugfixes

Papeeria Mobile

We have moved pane switchers from the top row to the left border. This makes UI more clean and understandable.

Editor panePDf pane

Bugfixes

Assorted small bugfixes. One of the most notable fixes: PDF positioning which didn't work if caret was in a file, incorporated into the main one with  \input directive.

Курсор Папирии, выпуск от 18 июня

В номере: обновление мобильной версии и багфиксы

Обновление мобильной версии

Перенесли переключатели панелей из верхней строки в вертикальный левый столбец. Кажется, стало удобнее.

Панель редактораПанель PDF

Багфиксы

Всего по мелочи. Пофиксили, например, позиционирование PDF, которое не работало если курсор находился в файле, включенном в основной файл командой \input

Friday, May 30, 2014

Papeeria News, May 28

TL;DR: insert plots easily; get notified about what you collaborators do; get closer to real-time editing

Plot builder

In the end of winter we launched a simple plot builder. It was pretty dumb and the only thing it could do was to build a histogram from CSV file. Now it is way more configurable. You can choose between a few types of 2-D plots, specify axis labels, tick label formatting and legend position. And with handy wizards you can insert a plot into your paper in just a few seconds.

How to start
Suppose you decided to insert a plot into this slide. All you have is a CSV file. What shall you do?

TODO: plot here


You could use a template "Simple line chart or histogram", but there is a faster way, which adds a CSV file, generates image and insert LaTeX markup simultaneously. Just position your caret where you want to insert a plot and hit Alt+Insert (or Cmd+N if you're on Mac). Choose Insert Chart... from the context menu and specify desired file name, figure caption and paste CSV data in a dialog window.

Chart wizard

Click Done ...and your plot is done. Recompile your project to see the result.

TODO: plot here Done!

Plot tuning
The plot is ready, but you may need a line chart or some other type of chart, and labels for axis. Open a CSV file which we've created from your CSV data and click cogs icon over the editor. In the plot settings pane you can tune a few parameters. Click Apply and we'll rebuild the plot, and if you check Show preview you will see it in the viewer pane.


Notifications

If you have collaborator in your project, you may want to be notified about their changes. We now have a notification widget which shows you the recent file updates, if any, and the authors who did the updates.
Нотификации

Real-time editing...

... is not yet completely done, but we're almost there.

We're still using file locks, and when someone is editing a file, the remaining collaborators can only read that file. But now they will see the edits in real-time. We're launching real-time collaborative editing soon. Stay tuned!

Wednesday, May 28, 2014

Курсор Папирии, выпуск от 28 мая

В номере: быстрое построение графиков, нотификации о действиях соавторов, очередной шаг к редактированию в реальном времени.

Быстрое построение графиков

В конце зимы у нас появилась возможность автоматической генерации гистограмм из CSV файлов. Ничего больше генератор тогда не умел. А теперь умеет. Разные типы двумерных графиков, названия осей, форматирование меток делений, позиционирование легенды - из этого вполне можно получить векторный график и за пару минут вставить его в текст работы или презентации.

Как создать график
Предположим, что вы решили, что вот на этом вот слайде презентации нужен график. Как его туда вставить?

Хочу график!


Можно воспользоваться появившимся ещё зимой шаблоном "Simple line chart or histogram", а можно сэкономить время и сразу сгенерировать график и вставить нужный код в документ. Это делает пункт Insert Chart... из контекстное меню в редакторе (Alt+Insert на Windows и Linux, Cmd+N на Mac OS). В диалоговом окне нужно указать название файла и подпись к графику и вставить CSV данные.

Вставляю данные


Нажать Done и... график сгенерирован, и код вставлен.

И результат готов

Настройка графика
Допустим, вам хочется линейный график, а не гистограмму, и нужны подписи к осям. Если открыть CSV файл и ткнуть в шестеренку над редактором, то появится панель с настройками. Выберите нужный тип графика, впишите подписи к осям, нажмите Apply и график перестроится. А если ткнёте в Show preview, то увидите как он будет выглядеть.


Нотификации

Если вы работаете над проектом не один, то вам хочется быть в курсе, что делают ваши коллеги. Саша сделал колокольчик, который показывает нотификации о недавних изменениях в файлах проекта.

Нотификации

Совместное редактирование в реальном времени...

... ещё не началось, но Гриша приблизил его ещё на несколько шагов.

Мы по-прежнему используем блокировки, и если кто-то редактирует файл, то остальные соавторы в это время могут этот файл только читать. Но теперь они получают изменения, сделанные писателем, в реальном времени. Скоро сделаем настоящее совместное редактирование.

Friday, April 18, 2014

Papeeria News, Apr 18

TL;DR: small user interface updates

Overwrite files when uploading

If you uploaded wrong file by mistake, you can quickly upload a new file and overwrite the existing one.

Overwrite option

Editor and viewer pane controls

Maximize/restore buttons look better now, settings like "wrap long lines" or "use Google Docs viewer" are hidden in sliding panes. Search field is not conflicting with them anymore.

Pane controls